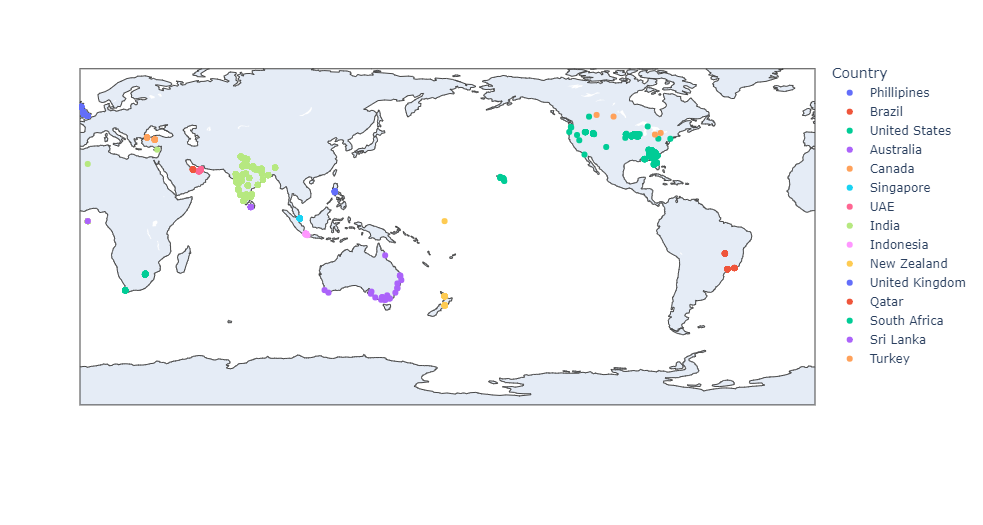
The analysis is done with the help of Python programming using libraries like Numpy and Pandas. Matplotlib, Seaborn, and Plotly are used in visualization. Zomato’s top transactions and their influential factors affecting the business are uncovered.
Skills: Python, Pandas, Numpy, Plotly, Seaborn and Matplotlib
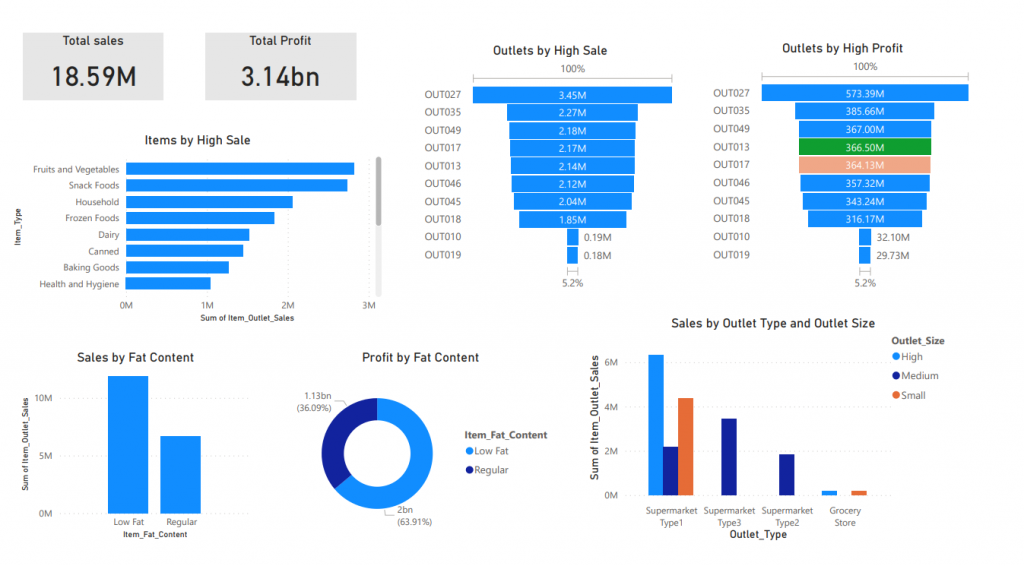
Sales Analysis with Power BI
The analysis is done with the help of Power BI to find the revenue generated in each outlet and the different aspects that affect the sales in each outlet. Different DAX formulas and power queries are utilized.
Skills: Power BI
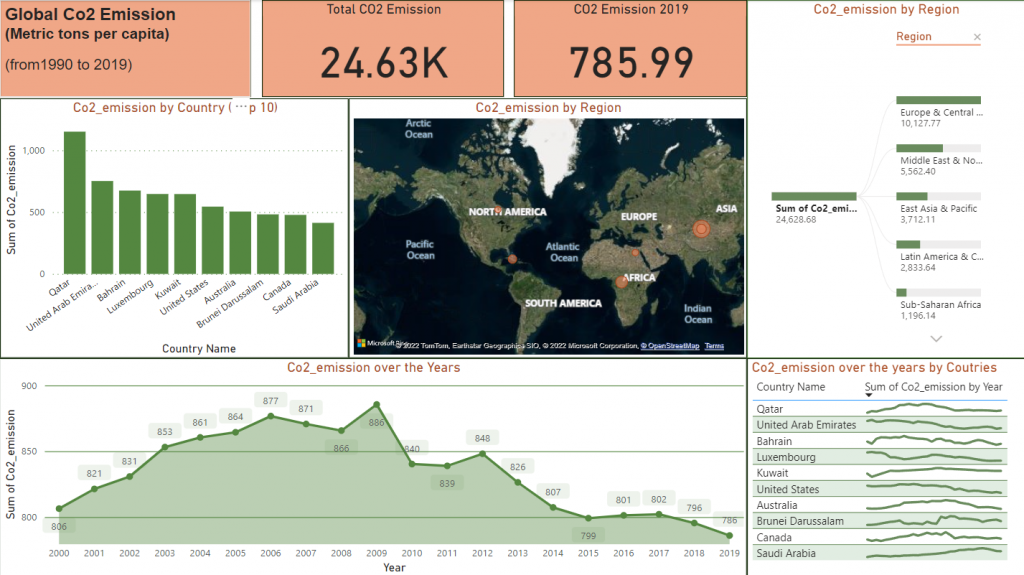
Analysis on Global CO2 emission with Power BI
Analysis are carried out to find the global CO2 emission from 1990 to 2019. Different countries associated with CO2 emission and their factors and patterns over the years are determined with the help of power queries.